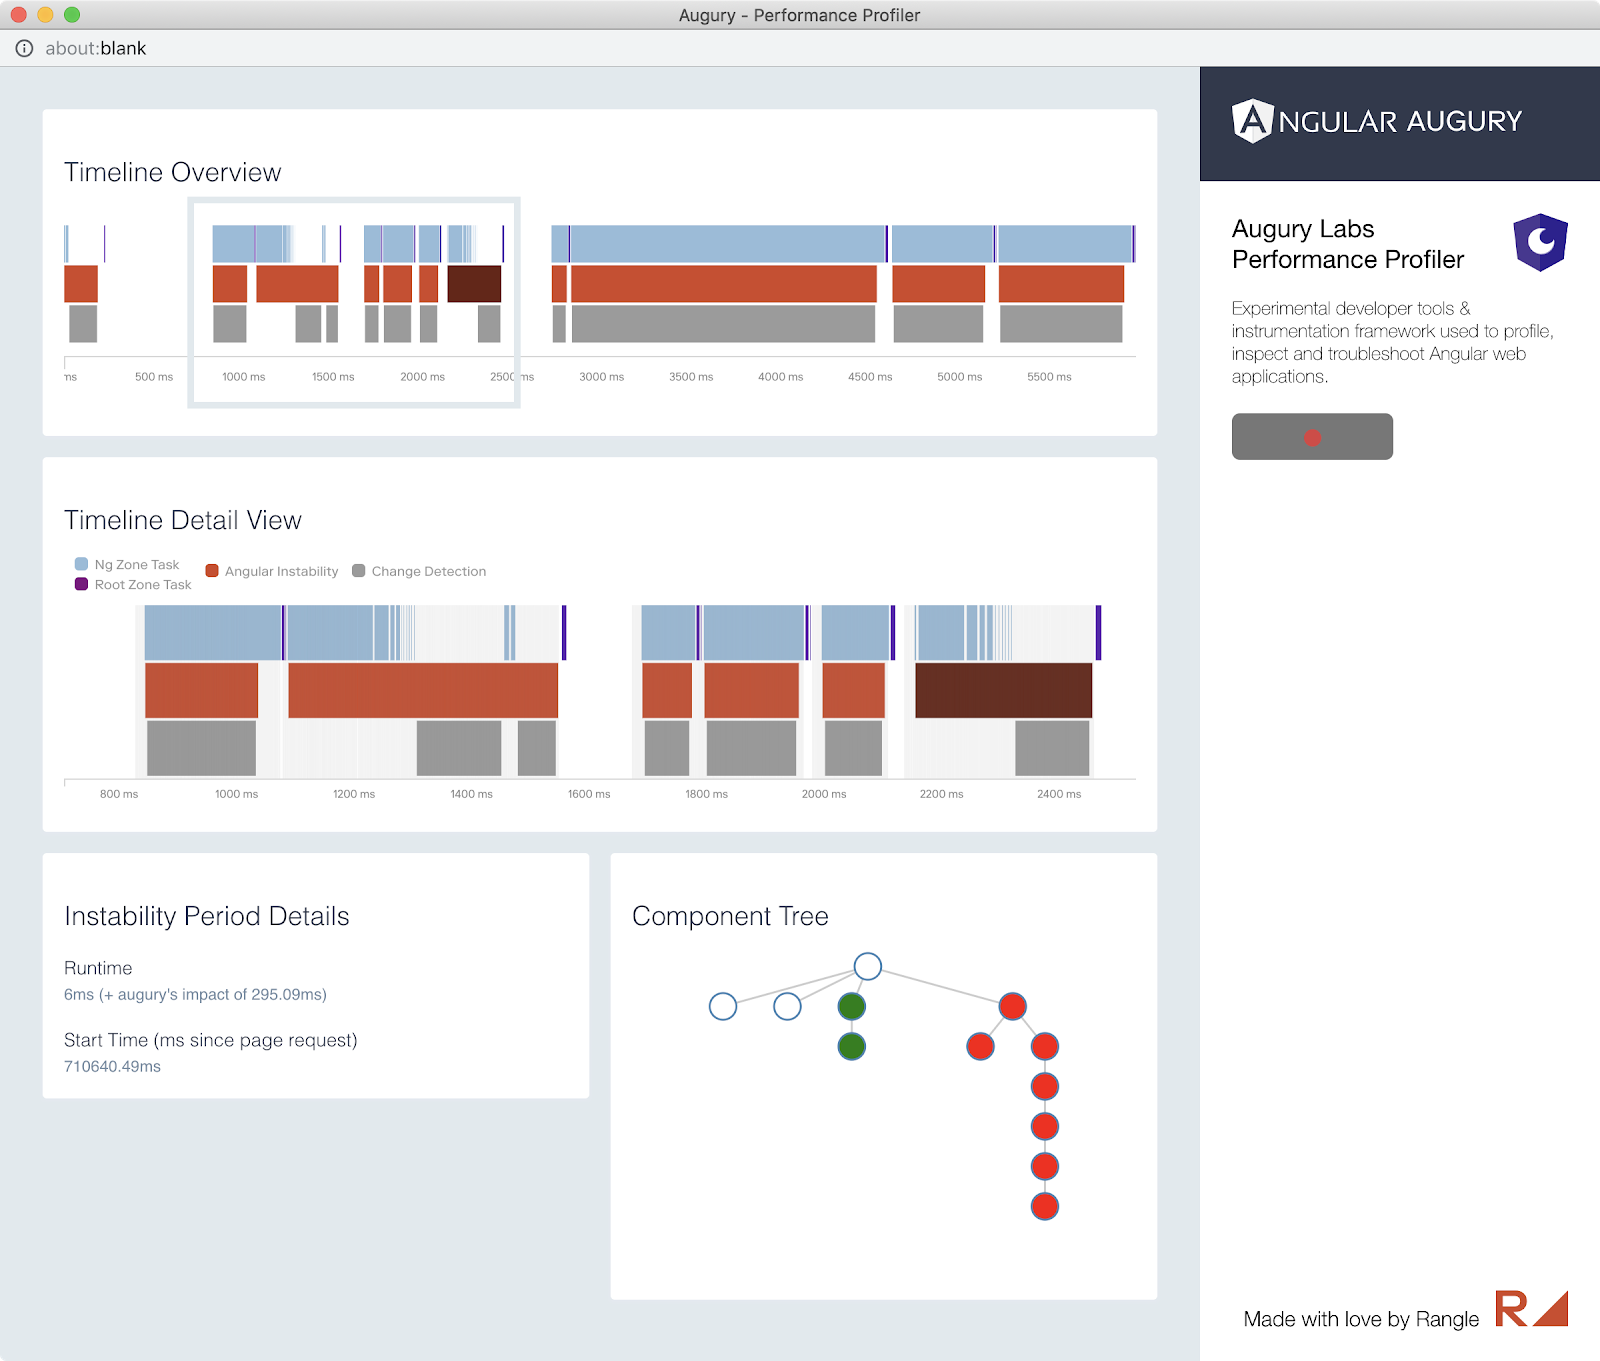
In 2015 Rangle introduced Augury, what is now the most used tool for debugging, profiling, and inspecting Angular applications with Google Chrome and Mozilla Firefox browsers. Augury helps you to visualize what's going on behind the scenes without having to sift through source code. In this post, I'll explain why our team is passionate about Augury and give you the first sneak peek at our new tool, Performance Profiler.
We've found that Augury is great for helping people understand what Angular is actually doing behind the scenes, especially for those new to the framework. More recently we started looking for new ideas, ranging from developer interviews to GitHub issues, we sought to determine what people were asking and what their pressing issues were.
We discovered that the component tree and inspection aspects of Augury were by far the most highly used. However, there were some other common problems developers struggled with that were not necessarily addressed by Augury as well as we would have liked. These ranged from state management, performance, dependency injection visibility, and a host of other items. Some of these challenges were solved by other tools (such as Redux DevTools), but not all of them. There were still some problems that we weren't able to address with the existing Augury DevTool extension.
This led us to our next question; "How can we help developers even more?"
Rangle's Augury Labs aims to help Angular developers troubleshoot performance problems. This is a challenging area even for experienced developers and it's an area not addressed by existing tools. Developer tools to help profile, inspect and troubleshoot Angular web applications.

As a developer or user you may notice lags in animations, but you might not know what's causing the issue. You could potentially have rogue code that's doing something to trigger change detection unnecessarily. When there's a lag in your application because of a few milliseconds here and thee it's acceptable in most cases, but if it's happening fifty times within the span of a second, you're going to notice the lag. When you get that type of feedback it can be overwhelming to determine where to start. Since narrowing down why those things are occurring can be challenging, we decided to try and help solve that problem. After we decided to tackle troubleshooting Angular performance, our next step was determining how we can actually help people identify those issues.
With other performance profiling tools, such as the built in browser DevTool performance profilers, we found that they catch a lot of non-Angular noise. This happens because they unintentionally lump in the bevy of things running behind the scenes. This can mean lots and lots of digging to find that one thing that might be the problem. Taking this into account, we saw an opportunity to approach this from an Angular-centric way. We built an architecture that allows us to extract raw data from the Angular application and then broadcast that information as events, which are further reduced into data views and then ultimately presented to the developer. In the case of the performance profiler, after you start recording, you can interact with the application where you're experiencing slowness, pause, and can then click around as the Performance Profiler has recorded what's actually happening behind the scenes specific to Angular. This means your timeline will show things such as zone.js tasks, Angular instabilities periods, and much more.
While the current Augury DevTool is distributed as a browser extension, the Augury Labs project is browser agnostic and published as a set of NPM packages - basically the same Angular itself. So you can run an NPM command from the command line to install the developer dependencies. Once that's done there are a few small code changes so the Augury Labs framework and Performance Profiler can be launched alongside your application.
Currently, we recommend using the Angular CLI and then creating new build & serve configurations. It's split it up so it's not running all the time because we're doing a bunch of profiling and instrumentation which slows the application down while it's running. For now, it's a manual 5-minute process to configure this new configuration so that you can start your application with this tool. We're hoping to improve that setup time by creating an Angular schematic to make the necessary code changes for you.
Rangle's Augury Labs is so thrilled to be launching this new product and be able to benefit the Angular community. Interested in trying Performance Profiler out for yourself? Keep in mind this is still a beta tool and has some known issues. We are looking for feedback to make it better.
Plus we have lots of other ideas that we could build off the Augury Labs framework. Some of which are listed on the Github project page.
You can also learn more about Augury Labs eponymous product Augury, here.


