Cryptocurrency is getting hotter by the second. Though Bitcoin is the big name in the cryptocurrency game, there are many other crypto players claiming to serve a unique and underserved purpose in the market.
I realize for a cryptocurrency to have succeed like Bitcoin, it needs to have network effects. In other words, regular users should be passionate about the coin in order to tell their friends about it. And if the code of the coin is open source, developers should care enough about it to make new contributions.
If these two requirements fall into place, a coin has a greater chance of achieving astronomical success. I'm always on the lookout for the "next Bitcoin" and am always curious which coin is being talked about more and more. I realized the simplest (read 'easiest') way for me to determine this would be to monitor Google Trends.
Google Trends gives you an idea of how much hype is behind a coin. The first place many newcomers come to learn about a coin is the Google search bar. Knowing this, I built a web application that investors or those interested in cryptos can use to view any cryptocoin and monitor its Google trends over the past six months.
Thus, CryptoTrend was born. I built the app using Vue.js. This is just a start and only a small piece of the network effects puzzle, but nonetheless it's easy to visualize and reason about.
What is Vue?
Vue.js is an open-source JavaScript framework comparable to React. It is a library that can be integrated with other JavaScript libraries. Although not fully comparable with Angular, working with Vue has a lightweight feel. Building an app with Vue felt quick and intuitive.
We favor React and Angular at Rangle, but when I was chatting with our Director of Software Delivery, Alamelu Radhakrishnan, she encouraged me to explore my interest and try building something on Vue as it's a framework we may want to incorporate into future projects.
Building CryptoTrend
CryptoTrend leverages data from two APIs: Google Trends and Coin Market Cap. This allows the application to present the price fluctuations/patterns of individual cryptocoins in comparison to their search trends. Cryptocoins can be sorted by market cap, 1 price change, 24-hour price change and 7-day price change.
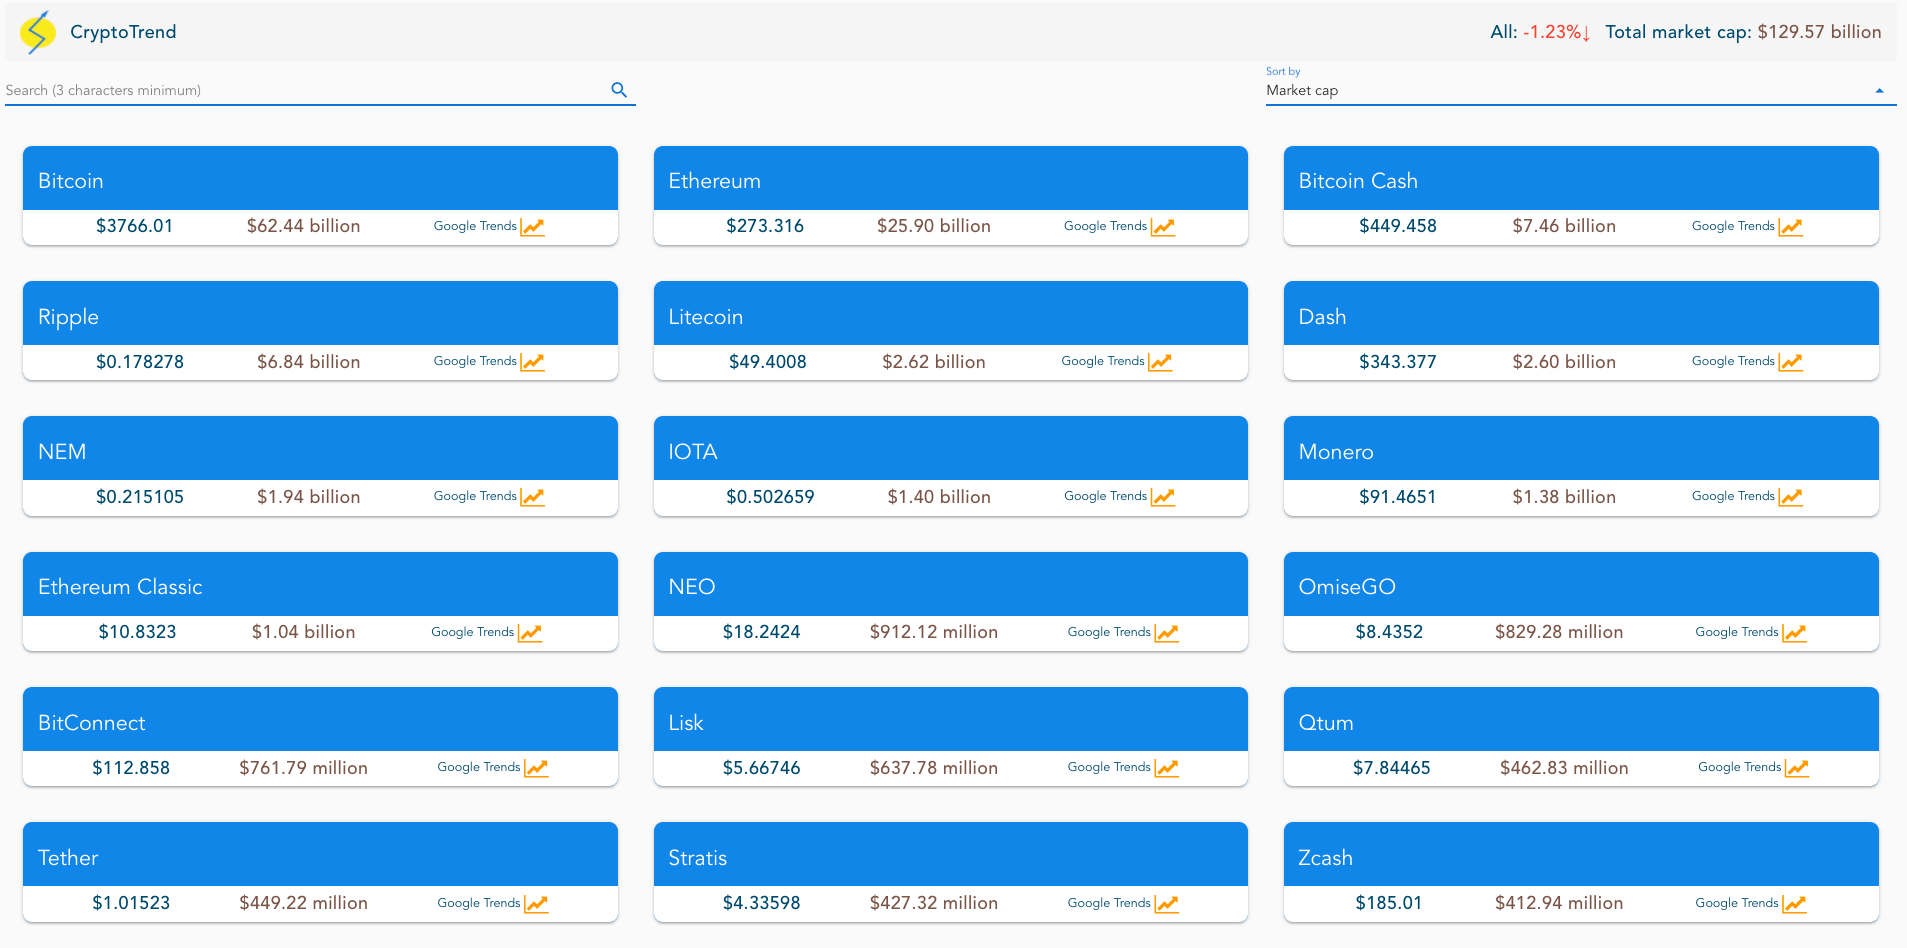
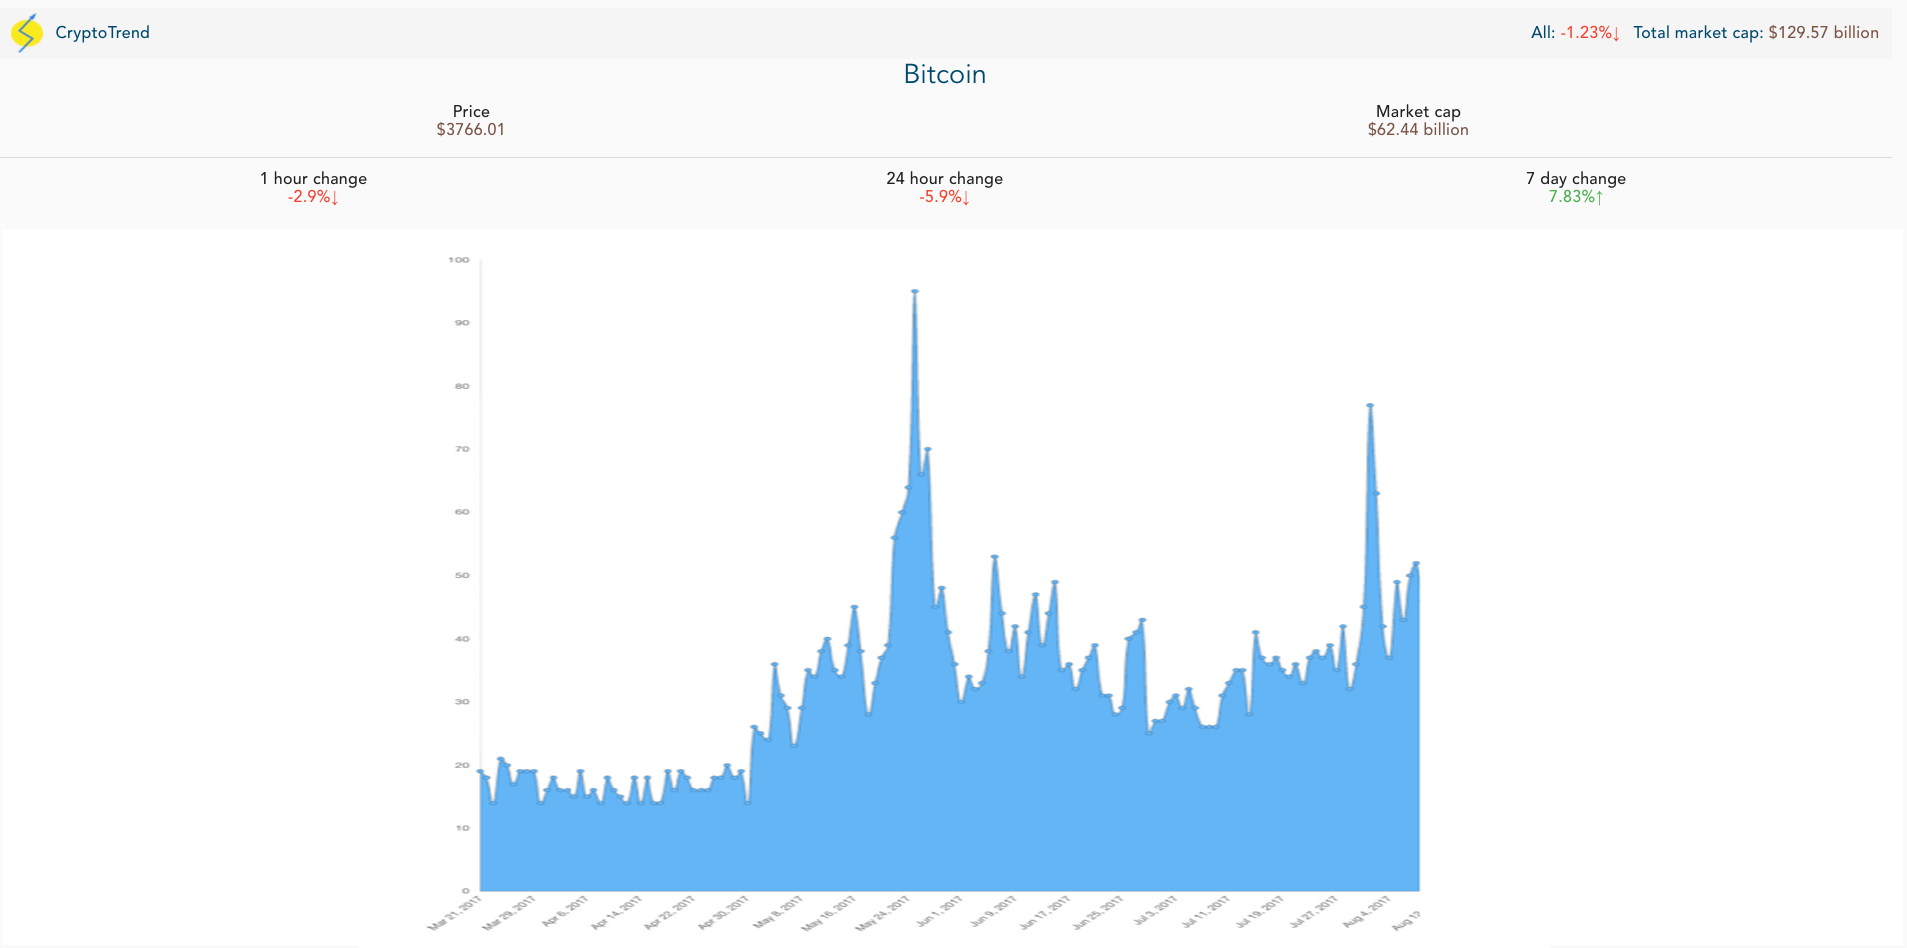
By clicking "Google Trends" you can go into that specific cryptocurrency to view its trend history over the past six months and basically visualize the public interest in this coin. You can also see the usual metrics of 1 hour, 24 hour and 7-day price change.
Building Additional Features
I posted CryptoTrend on Product Hunt, a website that features new products everyday. I wasn't expecting much, but the feedback I received was incredible. I'm now looking into adding more robust features, including adding historical price data in the same plot as Google Trends data to view the correlation of price and trend. If any developers want to join, get at me :)
Building Additional Features
I found my experience building an application with Vue.js to be a relatively natural progression and I appreciated the opportunity to explore another form of front end development.
Although we're not using Vue.js at Rangle at the moment, I think it's important for developers like myself to experiment with new technologies, libraries and frameworks. It's one of the best ways to develop your skills. Plus, you never know when a client is going to want to try something new.
If you want to learn more, don't hesistate to contact us.