Have you ever wondered about the term "bundle size" and its significance in web development? Bundle size refers to the combined file size of all JavaScript code, libraries, and dependencies that are bundled together and served to the end-user in their browser. Larger bundle sizes can increase your page load times and ultimately lead to a less responsive and less engaging user experience.
As a developer, there may be times when you come across the need to remove modules that were once part of your project. For example, they might have been replaced with alternatives or become deprecated and no longer required, yet still exist in your codebase. Dealing with this aspect of development can be challenging. However, as we navigate through these situations, we often acquire insights and wisdom that can assist others facing similar challenges in the future.
With that goal in mind, I'd like to share some guiding principles and tools that can aid us in this task. Our focus will be on utilizing Webpack Bundle Analyzer and Statoscope to optimize our app's bundle size. These tools help us visualize and comprehend how blocks of code come together to form our application. In doing so, they enable us to precisely identify areas within our bundle that we can improve and optimize.
Understanding Bundle Size and Its Significance
You’re probably familiar with Webpack, but as a quick refresher: it's a JavaScript module bundler that compiles, transforms, and packages your app's source code, along with its dependencies, into output files that browsers can load. Webpack is often included by default in boilerplate setups for React apps or frameworks like NextJS.
Before we delve into specifics, let's take a moment to grasp why bundling is essential in web development. Bundling is crucial for optimizing web applications as it reduces the overall code size, simplifies dependency management, ensures correct loading order of required files, and improves caching. All of these contribute to a faster and more streamlined user experience. This is particularly crucial since you can't anticipate the type of device your users will have or the speed of their internet connection.
One of the primary benefits of bundling is the reduction in code size. Combining multiple files into one or a few smaller files allows more effective minification, eliminating unnecessary whitespace, comments, and redundant information. This results in a smaller file size, enabling browsers to download and process the code more rapidly.
While processes like tree shaking, chunking, and code splitting usually help maintain small bundle sizes and remove unused modules, they don't always catch all cases. Certain tools and techniques can assist in such situations. For instance, barrel files can serve as indexes or entry points, making it easier to import and manage module dependencies. However, barrel files can sometimes prevent the removal of unused modules from the final bundle.
The use of export * can export everything from a module, potentially including exports that aren't used in the application. This can confuse bundlers and tree-shaking algorithms in identifying which exports are actually being used and which can be safely removed.
Code splitting involves breaking down your application's code into smaller chunks rather than serving it as a single, large bundle. This is an automatic feature in NextJS that contributes to its popularity. By loading only necessary chunks for a particular page, this approach reduces the amount of code that users must download and execute during their initial interaction with your application.
Visualizing Your Bundle Size with Webpack Bundle Analyzer
Webpack Bundle Analyzer is a powerful tool that generates visual representations of your JavaScript bundle size. This aids in pinpointing areas for optimization within your project. It can highlight larger dependencies and duplicated or unused modules that could be removed to reduce your bundle size.
To begin, you need to install the tool in your project:
npm install -save-dev webpack-bundle-analyzerFor NextJS projects, you'll need to use a different bundle analyzer:
npm install @next/bundle-analyzerAdditional configuration is required for NextJS projects. More setup information for React and Webpack Bundle Analyzer can be found here. If you’re using NextJS, create a next.config.js file in your project's root directory if you don't already have one. This file will include the necessary plugin setup.
Below is an example of the setup code for your next.config.js file. You can find more information about the setup here for NextJS, as well as here.
// next.config.js
module.exports =
   ({ enabled = true, openAnalyzer = true } = {}) =>
       (nextConfig = {}) => {
         return Object.assign({}, nextConfig, {
           webpack(config, options) {
             if (enabled) {
               const { BundleAnalyzerPlugin } = require('webpack-bundle-analyzer')
               config.plugins.push(
                   new BundleAnalyzerPlugin({
                     analyzerMode: "static",
                     openAnalyzer,
                     generateStatsFile: true,
                     statsFilename: !nextRuntime
                         ? "stats.client.json"
                         : `stats.${nextRuntime}.json`,
                     reportFilename: !options.nextRuntime
                         ? `./analyze/client.html`
                         : `../${options.nextRuntime === "nodejs" ? "../" : ""}analyze/${
                             options.nextRuntime
                         }.html`,
                   })
               );
             }

             if (typeof nextConfig.webpack === 'function') {
               return nextConfig.webpack(config, options)
             }
             return config
           },
         })
       }
Upon building your NextJS project using the build command, the plugin will generate an interactive treemap and open it in your browser.
Interpreting the Treemap
The interactive Treemap illustrates your bundle's size and structure. Each nested rectangle represents a module or dependency, with larger rectangles denoting larger sizes.
Pay attention to the Treemap's organization and hierarchy. It provides insights into the overall structure and relationships between modules in your project. The hierarchy enables you to analyze your bundle at various levels of granularity, from broad entry points to specific modules and files.
By navigating the Treemap and examining its hierarchical structure, you can identify components contributing the most to the bundle size. These components can then be targeted for optimization.
Hovering over a module displays a tooltip with additional information like module size, name, and path. This, along with the search feature in the left panel, is especially helpful when locating specific modules and confirming a module has been removed. You can also toggle the Treemap view to display Stat, Parsed, or Gzipped sizes. The Gzipped size is particularly relevant for file-transfer speed.
Analyzing and Identifying Unused Imports with Statoscope

Statoscope is another tool used for analyzing and visualizing your bundle. To use it, visit statoscope.tech and drag and drop your stats.json file generated from the bundle analyzer. This creates a comprehensive report that you can explore for further insights.
The first tab, "Entrypoints," displays your application's starting points, where Webpack initiates bundling. From here, you can navigate to entry points and specific modules. The "Reasons" section provides information about why a given module was imported, such as explicit import statements or dependencies required by other modules.
In the video below, we navigate through the report generated on Statoscope.
The "Issuer Path" section, nested within Reasons, lists the chain of parent modules that necessitated or imported a given module. This information helps trace back to the root entry point responsible for including the module, so you can decide if it's safe to remove it.
While Webpack Bundle Analyzer excels at identifying large, duplicated, or unused modules, it doesn't characterize why and where these modules are present. Statoscope bridges this gap by furnishing detailed information about module imports and reasons within your codebase.
The next step is to remove all instances of the unwanted module's import from your project. After making these changes, rebuild your app and rerun the bundle analyzer. Take a look at the revised Treemap to verify your new bundle size. Utilize the search feature to ensure the module is no longer part of the bundle. This iterative process helps track progress and how you’re optimizing your bundle.
A Brief Case Study
By applying these tools to our own website project, we reduced our bundle size by nearly 50%, just by modifying how we loaded a single library.
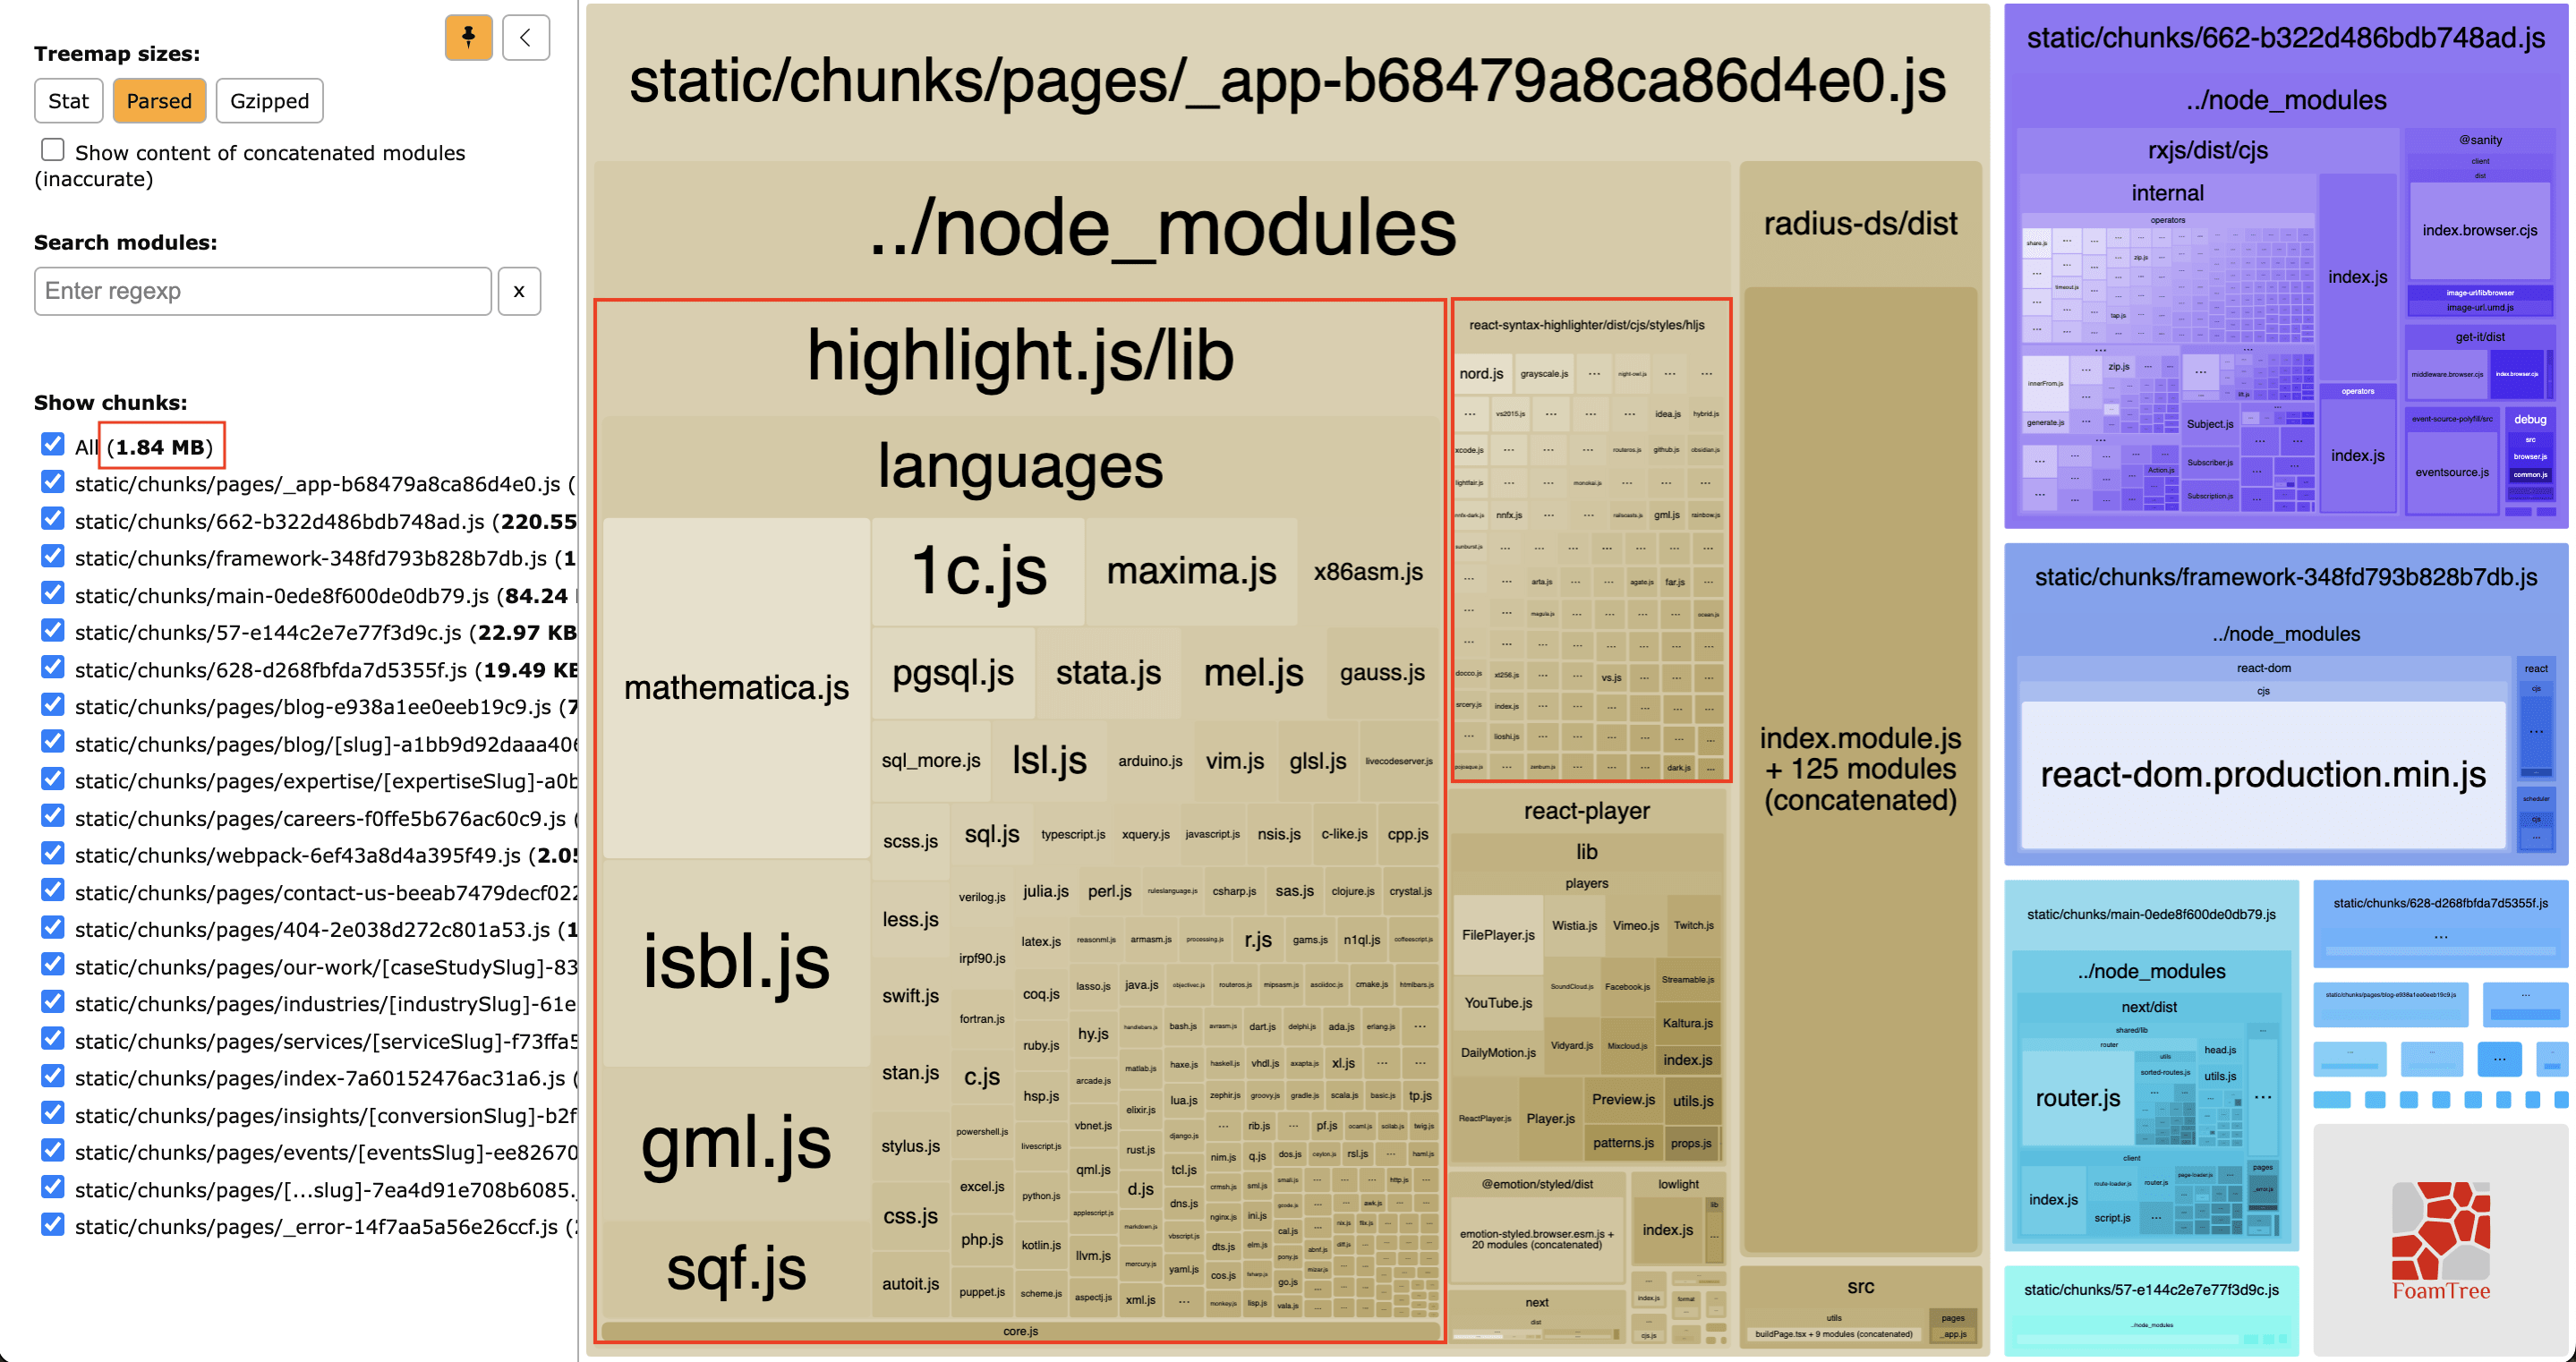
We observed a sizeable library, highlight.js, that contributed significantly to our bundle. While not directly imported into our code, highlight.js was used by another library, react-syntax-highlighter. This library is used, for example, to format the code snippets in this blog article.
As you can see in the graphic below, a large number of files were loaded – all but five of which were for languages we didn't need to support in our content management system.

Highlighted in red are the highlight.js and react-syntax-highlighter libraries.
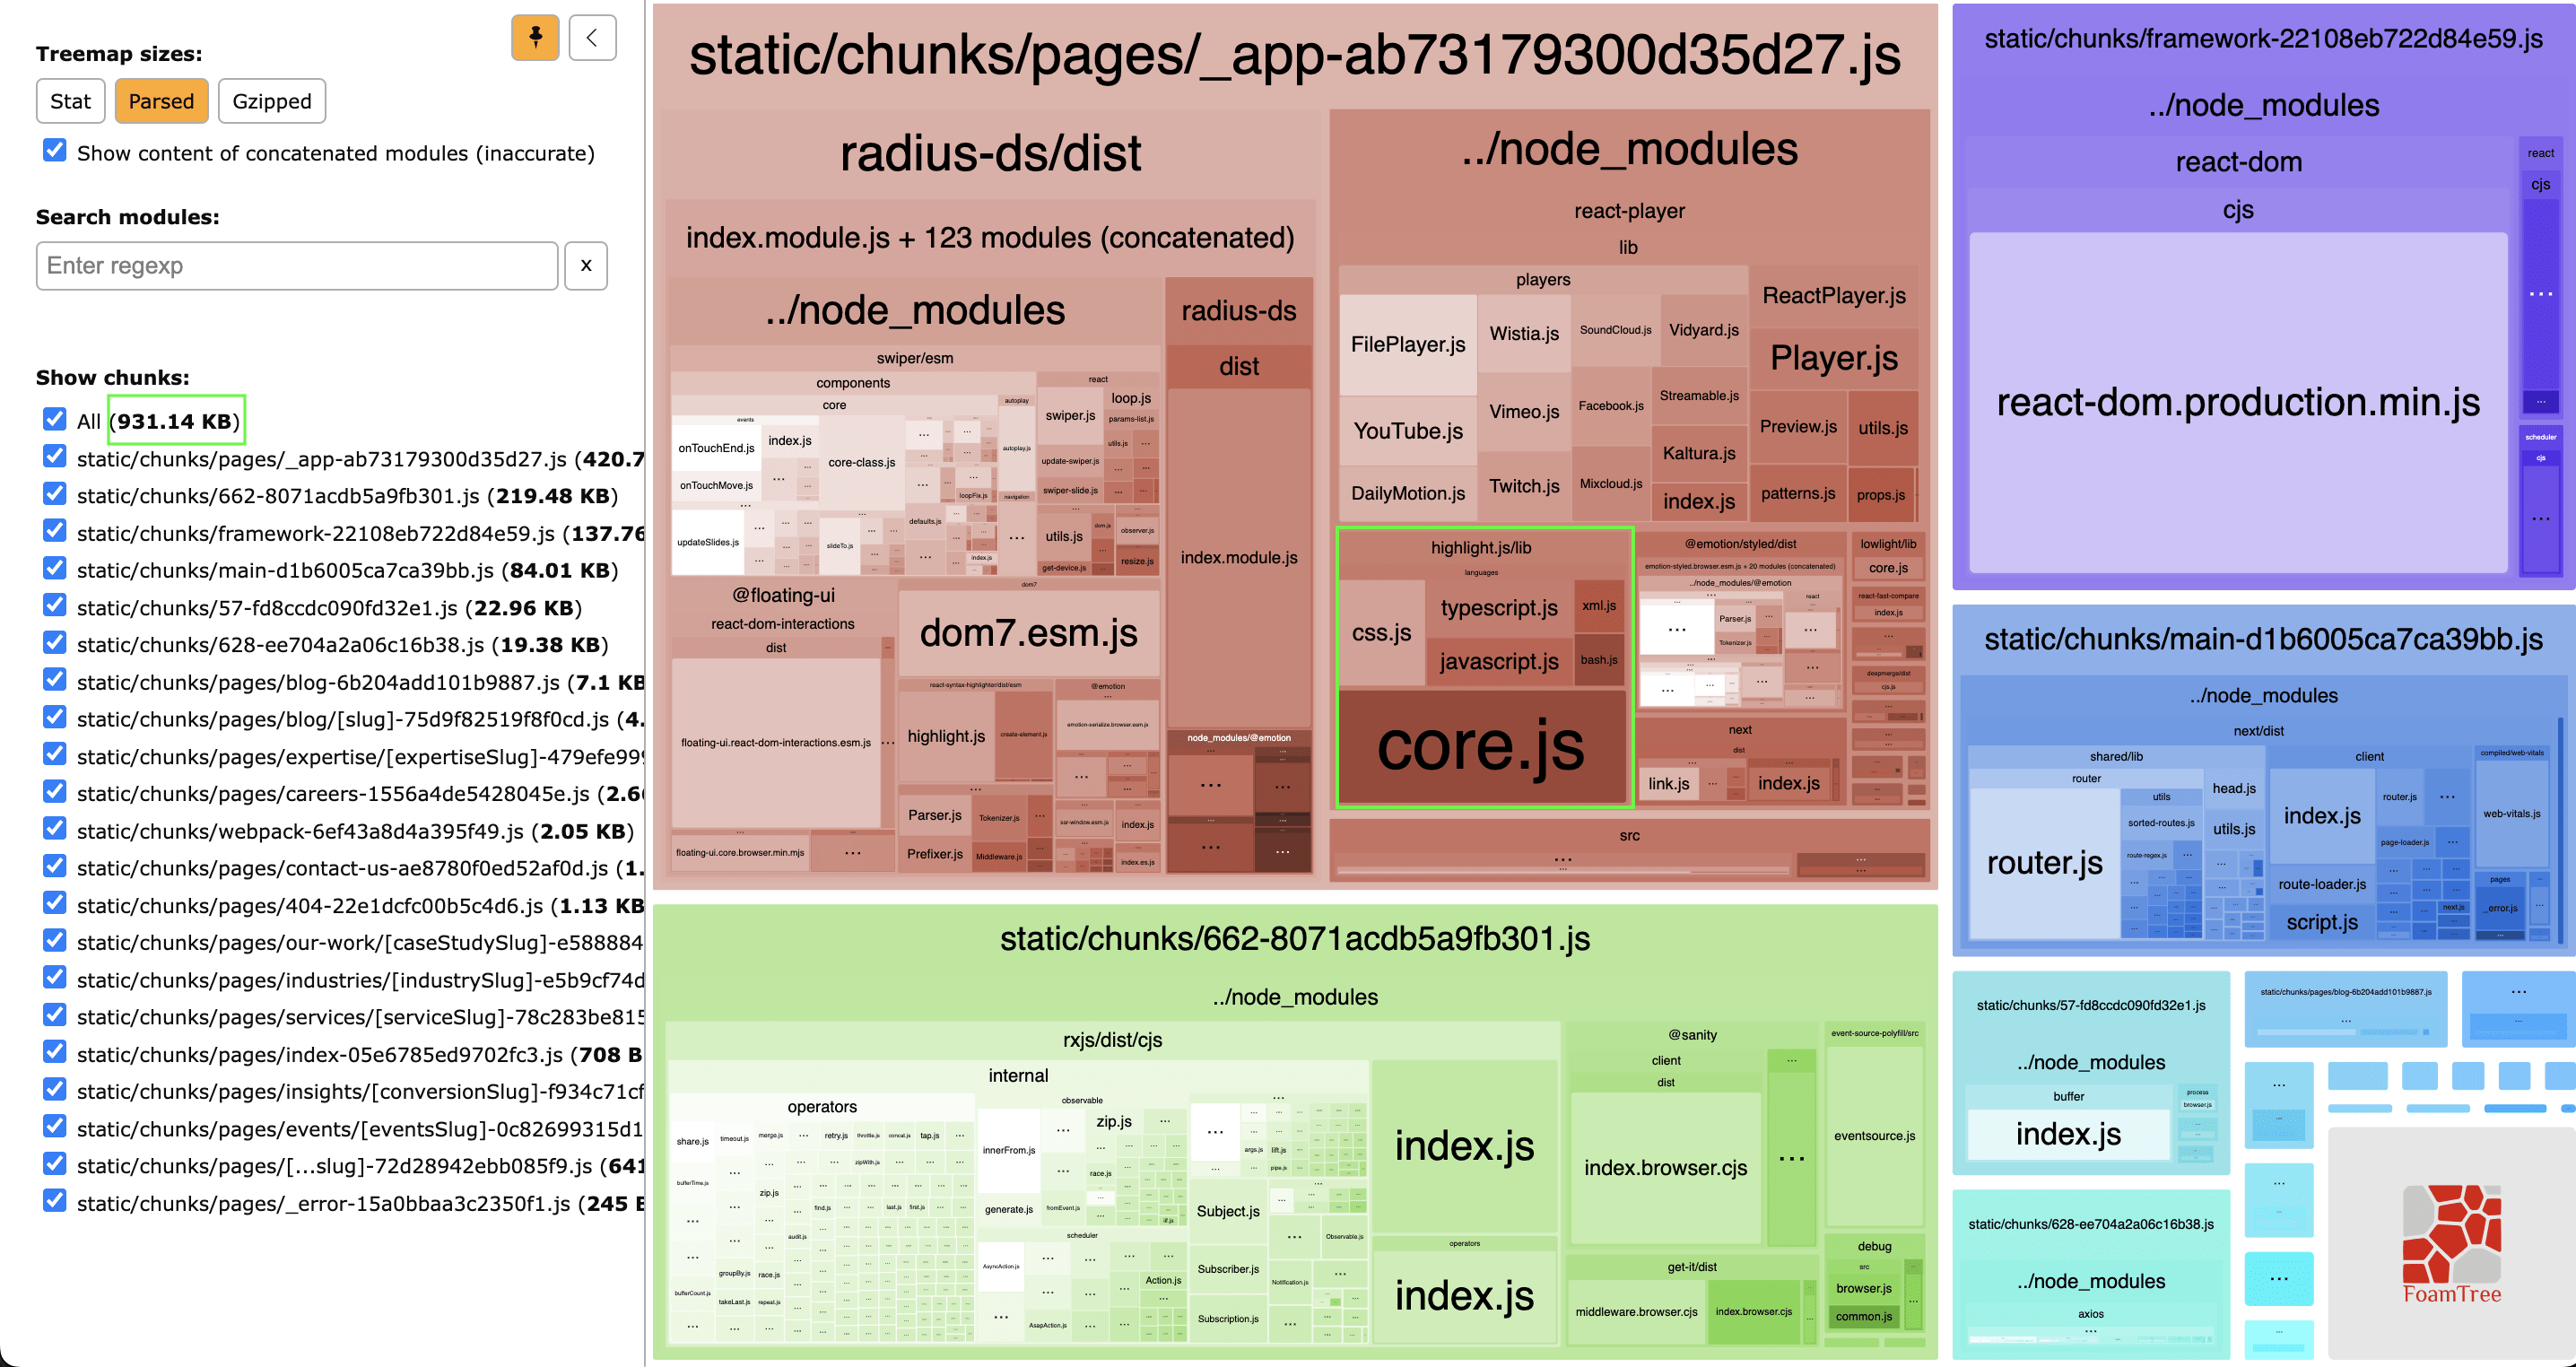
Our bundle size decreased remarkably by importing importing only necessary languages:
import javascript from 'react-syntax-highlighter/dist/cjs/languages/hljs/javascript'rather than the entire library:
import SyntaxHighlighter from 'react-syntax-highlighter'
Upon reevaluating the bundle analyzer's Treemap, our total parsed size shrunk from 1.84 MB to 931.14 KB – a near 50% reduction.
This case study demonstrates how examining the Treemap and making targeted changes to imports can significantly optimize bundle size.
Conclusion
With Webpack Bundle Analyzer and Statoscope, we can better understand our codebase and identify areas for improvement. These tools not only spot large or unused modules but also provide context for their presence in your code. Visualizing your project's composition using these tools can help you understand page load times and otpimize your website's performance.
Proactively monitoring and optimizing your bundle size are critical to consistently delivering fast and efficient user experiences.
We recommend integrating Webpack Bundle Analyzer and Statoscope into your DevOps pipeline to continuously optimize your code. For example, you can set up automated alerts to notify when bundle size surpasses a set threshold, akin to test coverage alerts.
